← Back

Arista Networks Valuation & Price Target Analysis: Navigating AI-Driven Growth and Competitive Risks

This analysis evaluates Arista Networks' valuation, growth prospects, and risks as of December 2025, focusing on its transition to AI infrastructure leadership and competitive dynamics with peers like Nvidia.

Highlighted Companies

Author: Analystock.ai

📋 Highlights
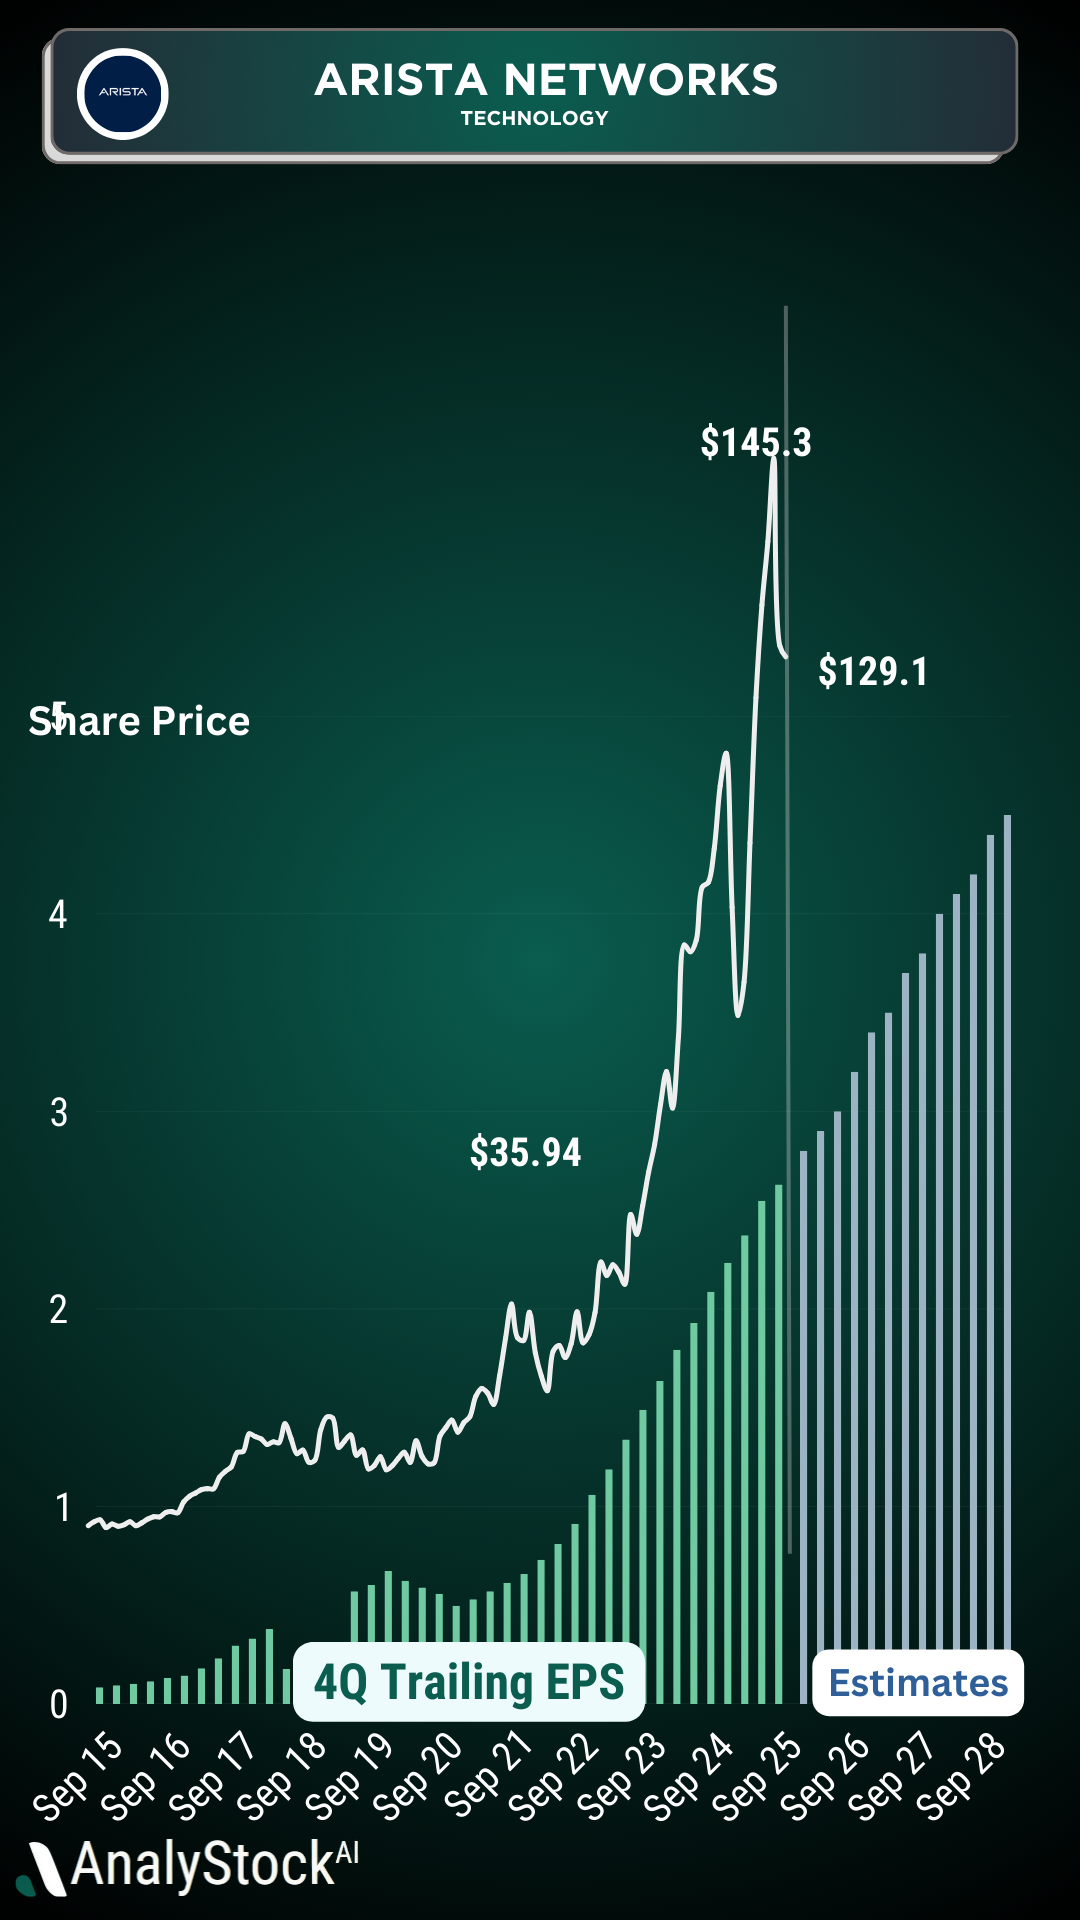
  • Strong Revenue Growth Driven by AI Infrastructure: Arista Networks delivered 27.5% YoY Q3 revenue growth ($2.308B) and is on track for $8.87B in 2025 revenue, with AI networking revenue now 26% of total sales and growing at 40-50% annually.
  • Attractive Valuation with High Margins & Cash Flow: Despite a 50x P/E ratio, Arista’s 64% gross margin, 39.7% net margin, and $4.05B in TTM free cash flow justify premium pricing, with a PEG ratio of 1.86 indicating reasonable growth-adjusted valuation.
  • Competitive Threats from Nvidia & Customer Concentration: Nvidia’s Spectrum-X is rapidly gaining market share (25.9% in Q2 2025 vs. Arista’s 18.9%), and customer concentration (Microsoft + Meta: 40-45% of revenue) creates execution and pricing risks for the company.
  • Long-Term Growth Potential in AI Networking: Arista could capture $40-75B in AI-related revenue by 2030 by securing 10-15% of the $400-500B AI data center networking market, supported by its technical moat in open Ethernet and hyperscaler partnerships.
  • Key Risks: Margin Compression & Capex Cycles: Gross margins face pressure from product mix shifts and competitive pricing, while hyperscaler capex cycles (historically cyclical) pose a risk of sudden demand contraction in 2027-2028 if AI ROI assumptions prove optimistic.
Image1

Current Valuation (December 2025)

Arista Networks' market cap stands at $162 billion, with a stock price of $128.59. Q3 2025 revenue reached $2.308 billion (+27.5% YoY), projecting full-year 2025 revenue of $8.87 billion. Key metrics include:

  • Price Multiples: P/E ~49-50x, Price-to-Sales ~19x, Forward P/E ~41x, PEG Ratio 1.86
  • Profitability: Gross Margin 64.34%, Operating Margin 42.88%, Net Margin 39.73%, TTM Free Cash Flow ~$4.05 billion
  • Balance Sheet: $10.11 billion cash with no debt

Base Case (12-Month View to December 2026)

Assuming $10.65B revenue in 2026 with 40% net margins, Arista could generate $4.3B net income ($3.40/share). Valuation scenarios:

  • 40x P/E: $136/share (current levels)
  • 45x P/E: $153/share (AI momentum)
  • 50x P/E: $170/share (premium growth)
Base case target: $150-160/share (~17-24% upside). Upside scenario: $175-185/share (35-45% upside). Downside scenario: $110-120/share (10-15% downside).

Middle Image

Bull Case (3-5+ Years to 2028-2030)

Long-term revenue could reach $25-35B by 2030 with 35-40% net margins. Valuation scenarios:

  • 30x P/E: $215-310/share (70-140% upside)
  • 40x P/E: $285-410/share (120-220% upside)
Key drivers: AI networking market growth to $400-500B, 10-15% market share, and enterprise expansion. Risks include margin compression and competition.

Bear Case (Execution and Competitive Risks)

Downside scenarios:

  • 2025-2027: Nvidia's Spectrum-X market share growth, margin compression, customer concentration risks
  • 2028-2030: Nvidia integration, white-box competition, AI growth slowdown
Severe downside: $57-71/share (55-65% decline) if growth slows to 10-12% annually and margins fall to 30-32%.

Relative Valuation & Peer Comparison

Compared to peers:

  • Cisco: 22x forward P/E vs. Arista's 40-50x
  • Nvidia: 50x+ P/E vs. Arista's 40-50x
  • High-growth software: 19x sales, 50x earnings
Arista's premium reflects faster growth (27% vs. Cisco's low single digits), higher margins, and AI exposure.

Price Target Summary

12-Month: $150-160/share (base), $175-185/share (bull), $110-120/share (bear).
3-Year: $200-250/share (strong execution), $160-180/share (moderate), $120-140/share (disappointing).
Long-Term: $300-400/share (bull), $200-250/share (base), $80-120/share (bear).

Business Model & Growth Drivers

Arista's transformation into an AI infrastructure leader hinges on:

  • Etherlink AI platforms: Scaling from 800GbE to 3.2Tbps for AI clusters
  • Software-driven margins: EOS platform enables 64% gross margins
  • 800G transition: $32B TAM with 3-5 year upgrade cycles
  • Enterprise expansion: Diversifying from 75% hyperscaler revenue

Key Risks

1. Nvidia Competition: Spectrum-X bundling, InfiniBand parity, and vertical integration threats.
2. Customer Concentration: 40-45% revenue from Microsoft/Meta exposes to capex cycles and pricing pressure.
3. Margin Compression: Product mix shifts, ASP declines, and tariff risks.
4. Capex Cycle Cliff: Hyperscaler spending volatility (e.g., 2018-2019 downturn).
5. Technology Disruption: InfiniBand, optical networking, and SmartNICs.

Investment Thesis

Bull Case: AI infrastructure spending accelerates, open Ethernet standards prevail, and enterprise adoption scales. Requires 15-20% AI market share and $25-35B revenue by 2030.
Bear Case: Nvidia dominance, capex contraction, and margin erosion. Risks include 50%+ stock decline if growth slows to 10-12% annually.
Verdict: Fairly valued with asymmetric risk/reward. Best suited for investors confident in AI's long-term secular growth and open ecosystem adoption.