Company Story
1984 - Ocean Power Technologies, Inc. was founded by Dr. George W. Taylor.
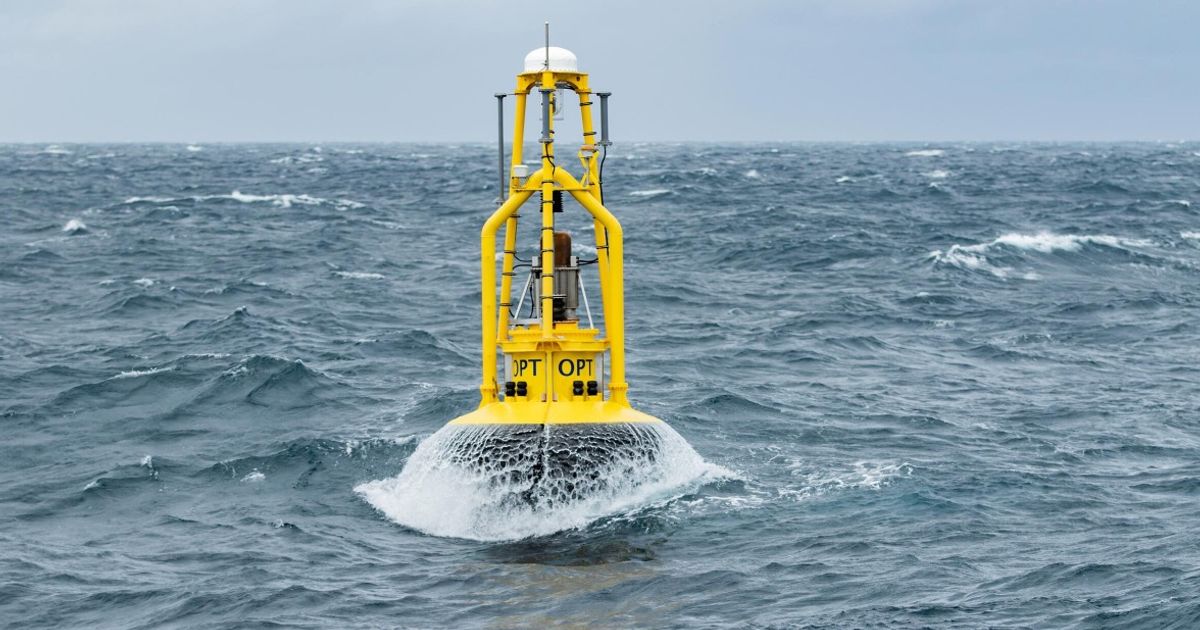
1995 - The company developed its first ocean-based wave energy converter, the PowerBuoy.
2004 - OPT listed on the NASDAQ stock exchange under the ticker symbol 'OPTT'.
2007 - The company deployed its first commercial-scale PowerBuoy system off the coast of New Jersey.
2010 - OPT partnered with Lockheed Martin to develop a wave energy project in Australia.
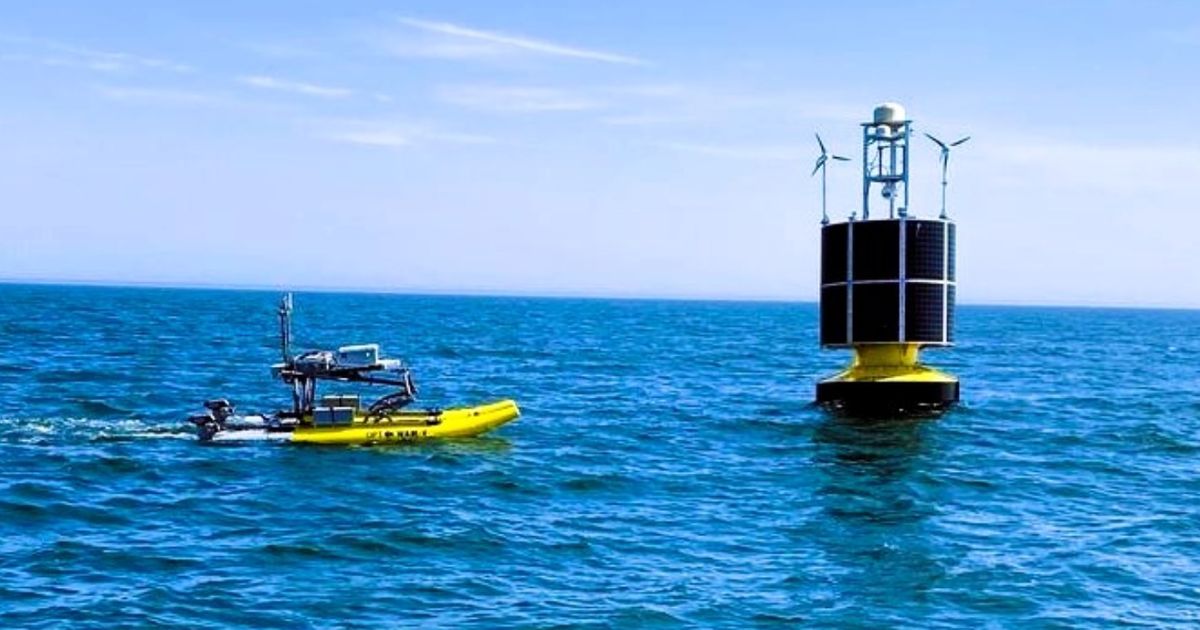
2012 - The company launched its APB350 (Autonomous PowerBuoy) for ocean observing and surveillance applications.
2015 - OPT partnered with Mitsui Engineering & Shipbuilding to develop a wave energy project in Japan.
2019 - The company launched its Subsea Battery System for offshore oil and gas applications.