Company Story
1996 - Magnolia Oil & Gas Corporation was founded by Steven J. Chazen
1997 - The company went public with an initial public offering (IPO)
2001 - Magnolia acquired oil and gas properties in Texas and Louisiana
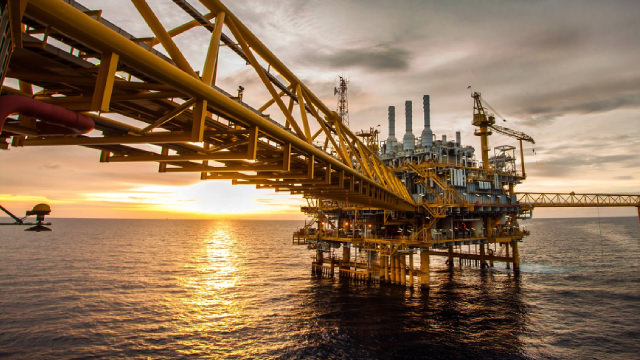
2005 - The company expanded its operations to the Gulf of Mexico
2010 - Magnolia acquired additional oil and gas properties in the Permian Basin
2014 - The company began exploring for oil and gas in the Eagle Ford Shale
2018 - Magnolia merged with a subsidiary of TPG Sixth Street Partners