Company Story
1935 - John W. Tyson founded Tyson's Feed & Hatchery in Springdale, Arkansas.
1947 - Tyson's Feed & Hatchery was incorporated as Tyson's Feed and Hatchery, Inc.
1963 - The company went public with an initial public offering (IPO).
1967 - Tyson's Feed and Hatchery, Inc. changed its name to Tyson Foods, Inc.
1972 - Tyson Foods, Inc. acquired its first poultry processing plant.
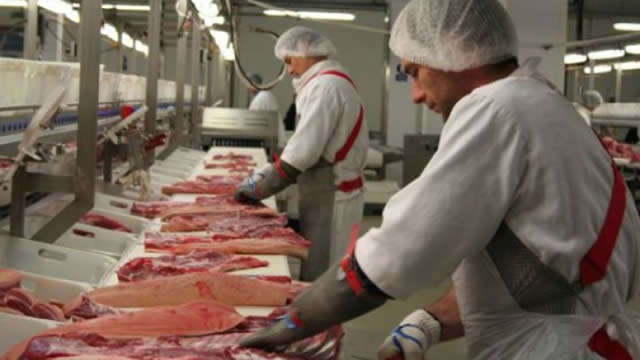
1983 - Tyson Foods, Inc. acquired Valley Foods, Inc. and entered the beef processing business.
1991 - Tyson Foods, Inc. acquired Holly Farms Corporation, expanding its poultry business.
1995 - Tyson Foods, Inc. acquired Cargill's poultry business in the United States.
2001 - Tyson Foods, Inc. acquired IBP, Inc., expanding its beef business.
2014 - Tyson Foods, Inc. acquired Hillshire Brands Company, expanding its prepared foods business.
2019 - Tyson Foods, Inc. acquired Keystone Foods, expanding its poultry and prepared foods business.